Photonic Systems Integration
Laboratory
Modeling and Characterization of Imaging Fiber Bundles
High-contrast imaging fiber bundles (FBs) are characterized and modeled for wide-angle and high-resolution imaging applications. Scanning electron microscope images of FB cross sections are taken to measure physical parameters and verify the variations of irregular fibers due to the fabrication process. Modal analysis tools are developed that include irregularities in the fiber core shapes and provide results in agreement with experimental measurements. The modeling demonstrates that the irregular fibers significantly outperform a perfectly regular ideal array. Using this method, FBs are designed that can provide high contrast with core pitches of only a few wavelengths of the guided light. Structural modifications of the commercially available FB can reduce the core pitch by 60% for higher resolution image relay.
Imaging fiber bundles (FBs) can be shaped into a curved focal plane using microgrinding. The curved image plane is mapped onto the flat sensor plane or a secondary flat image plane using the FBs. The motivation of using FBs is to make the conventional imagers more robust and compact by taking advantage of monocentric lenses with curved image planes. Modeling, characterization, and optimization of these straight FBs have gained interest for integrated imaging applications. The focus of this work is on straight FBs.
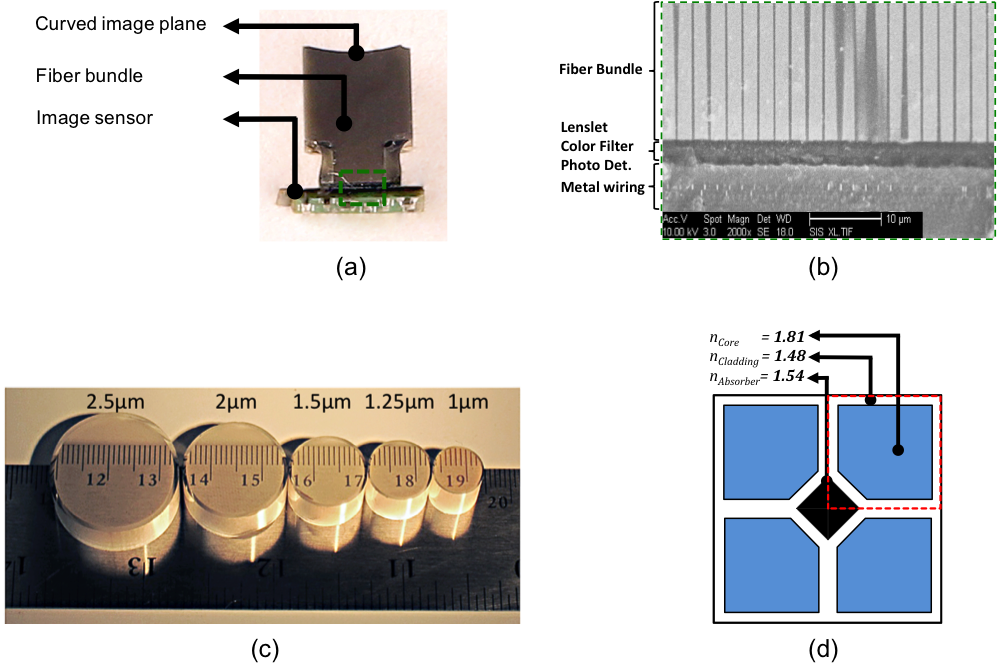
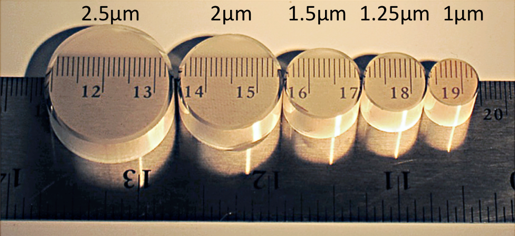
Fig. 1. (a) Fiber-coupled image sensor cut along the fibers and (b) its SEM cross-section. (c) Scaling of imaging fiber bundles with different pitches. (d) Schematic of the 5-sided FB cross-section.
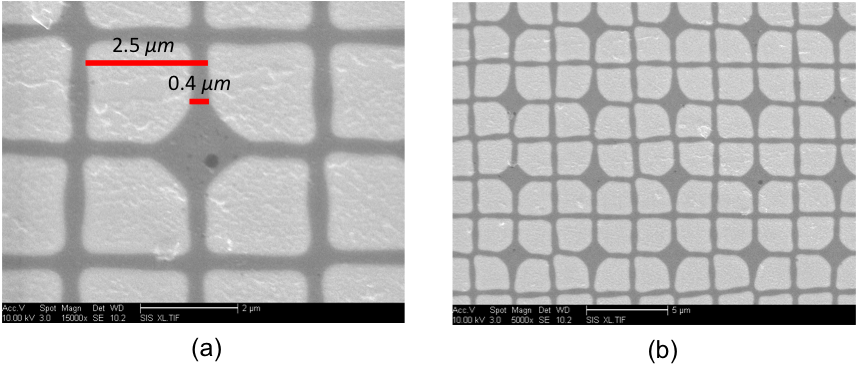
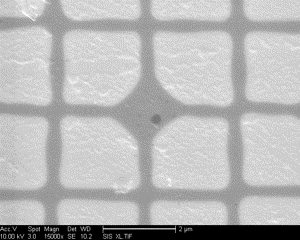
Fig. 2. (a), (b) SEM image of 5-sided FB with a pitch of 2.5 μm at 15,000x and 5,000x magnifications
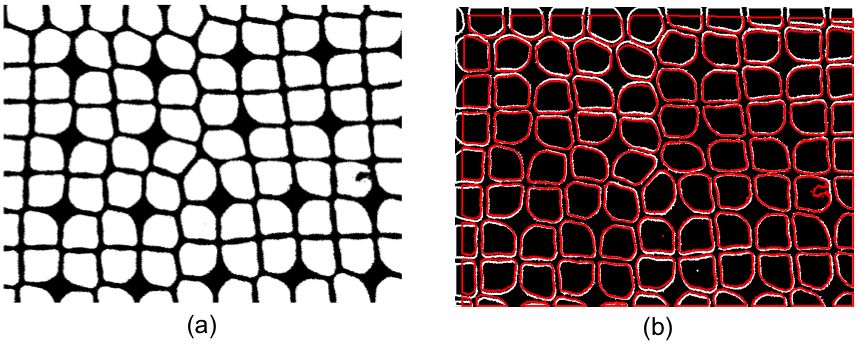
Fig. 3. (a) Conversion of SEM image to black (cladding and absorber regions) and white (core region). (b) Core boundaries obtained from the SEM image of 5-sided FB with a pitch of 2.5 μm (White boundaries from side 1 and red boundaries from side 2 after 10mm fiber drawing).
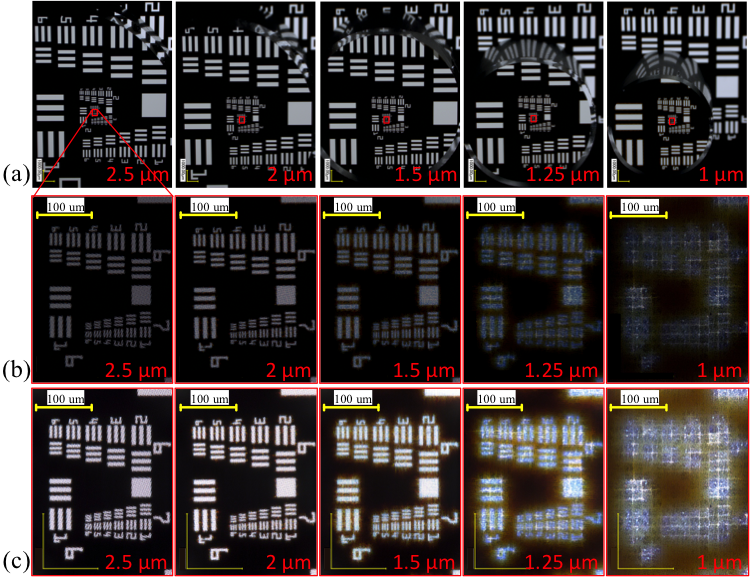
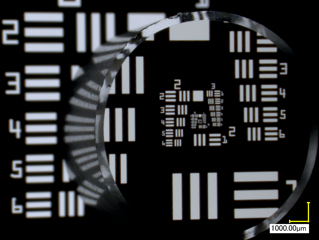
Fig. 4. Qualitative examination of scaling effect on the performance of FBs, (a) different pitches of fiber bundles on top of the resolution chart, (b) 20X magnification image passed through the 1cm long FB, (c) the same image as in (b) but saturated to magnify the cross-talk between the fiber cores.
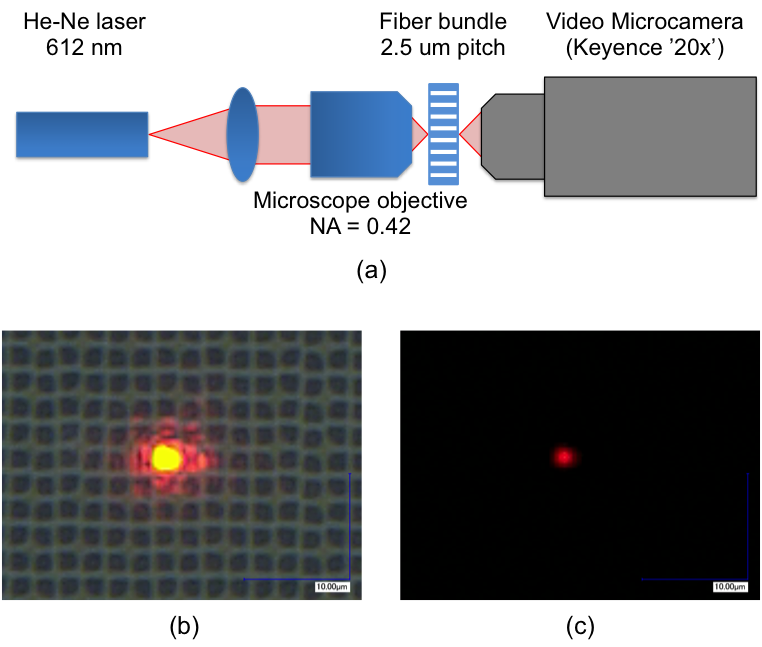
Fig. 5. (a) Schematic of impulse response measurement, (b) saturated focused laser light with white light background to illuminate the fiber grid, and (c) focused laser light on the center of the fiber core.
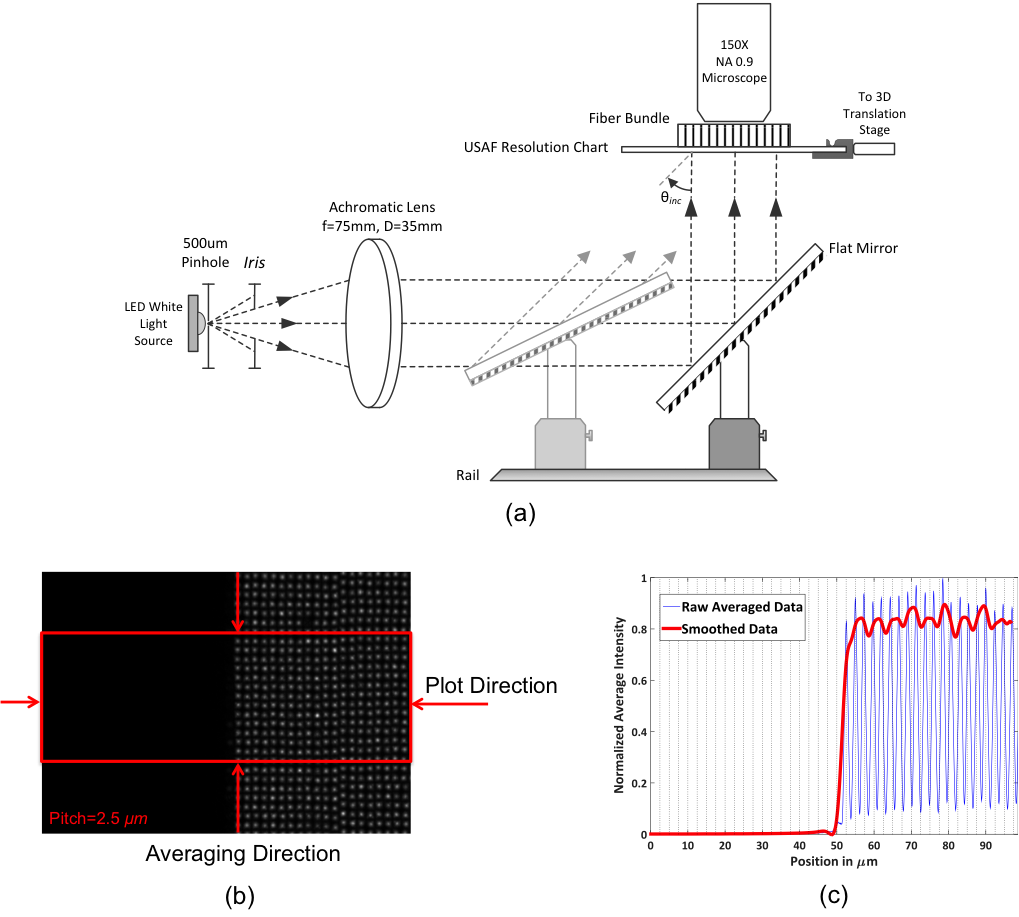
Fig. 6. (a) Schematics of the measurement setup: collimated white light incident on the FB on top of USAF resolution chart, (b) transmitted image of the edge through the FB at normal incidence, (c) averaged intensity plot in the direction normal to the edge.
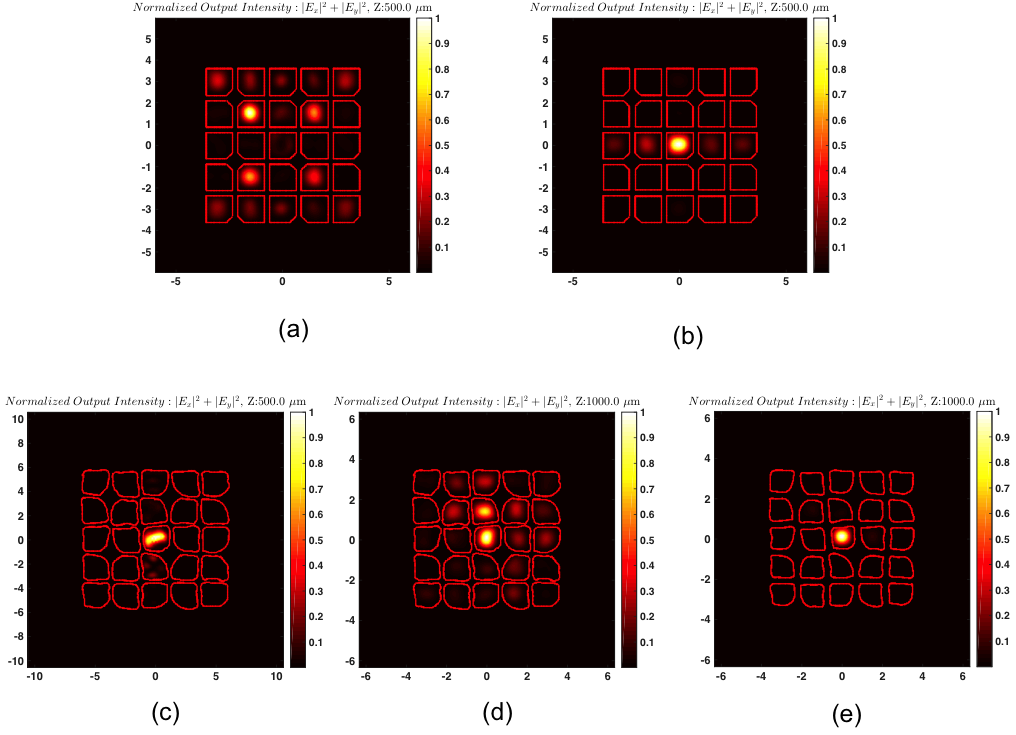
Fig. 7. Transmitted beam from (a) a regular waveguide array (b) irregular waveguide array with 1% variation in core width. Normalized transmitted intensity in (c) SEM cross section of 2.5 µm pitch fiber bundle with 70% core area, (b) same scaled cross section used for 1.5 μm pitch and (c) numerically eroded to 50% core area with 1.5 μm pitch.
Video of beam propagation along a 500 μm long straight fiber bundle with (left) 1.5 μm pitch and 70% fill factor, (middle) 2.5 μm pitch and 70% fill factor and (right) 1.5 μm pitch and 50% fill factor
JOURNAL PUBLICATIONS: